
Hyperliquid wallet research · HyperStats data
A PnL rank is
only the start.
What 100 Hyperliquid wallets reveal about reading a leaderboard before choosing a wallet to copy. One frozen snapshot. Three useful differences.
Research · Hypertg by HyperStats · Updated
Read the outcome. Check the context.
Three views.
One leaderboard.
Snapshot ·
100 wallets selected by 30-day realized PnL.
Every number describes this selected sample. The study does not measure all Hyperliquid traders or future copy-trading returns.
Finding 01
Dollar profits are concentrated.
The first 10 wallets contribute $74,594,454.66 of the sample’s $224,634,716.12 in reported 30-day realized PnL. The median wallet reports $1,518,166.01. These are totals for the selected 100 wallets, not a share of all Hyperliquid profits.
A dollar PnL leaderboard favours large absolute outcomes. It does not tell you how much capital was needed, how much drawdown occurred or whether the same trades could be copied.
Finding 02
PnL order and grade tell different stories.
Only 25 of the 100 selected wallets have an S or S+ grade. The remaining 75 span A+ through F. In this snapshot, the second wallet by 30-day PnL has a C grade and the third has a D grade. A high position in one dollar-PnL ordering does not imply the highest composite grade.
HyperStats describes its grade as a blend of realized exit quality and evidence from trading activity, realized PnL and deployed risk. This study describes the grade distribution; it does not independently validate that model or show that a higher grade predicts future returns.
Finding 03
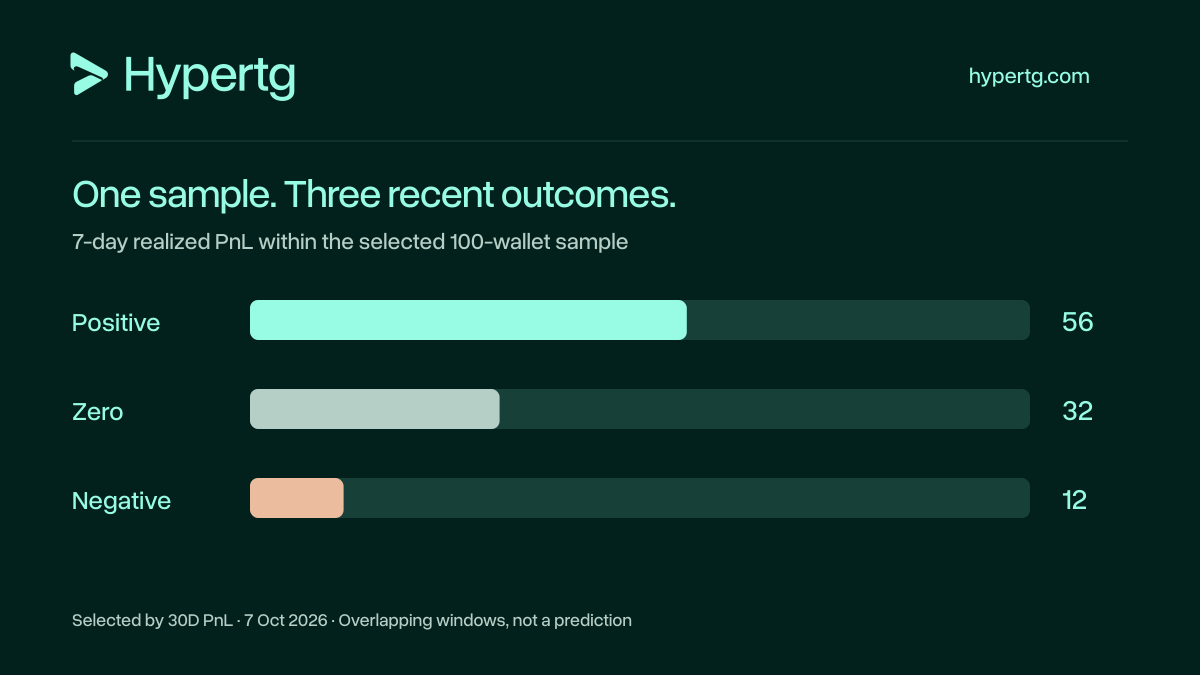
A positive month can include a losing week.
Among these 100 positive-30D wallets, 56 report positive 7-day realized PnL, 32 report exactly zero and 12 report negative values. The 7-day window overlaps the 30-day window. This is a same-snapshot comparison, not a test of what happened after a wallet entered the leaderboard.
Check several windows and the underlying exits. A zero value is not proof of no trades: realised gains and losses can offset. Recent realised PnL also leaves open-position PnL outside this comparison.
Inside the sample
The first ten.
With more context.
Rows follow the captured 30D PnL order. Wallet links open current HyperStats profiles; the values below remain frozen.
| Sample # | Wallet | Grade | 30D realized PnL | 7D realized PnL |
|---|---|---|---|---|
| 01 | 0x30af…393e | S+ | $18,230,692.29 | $0.00 |
| 02 | 0xbf73…5d58 | C | $12,939,993.32 | $91,840.40 |
| 03 | 0xf29c…9971 | D | $7,044,955.73 | $27,780.36 |
| 04 | 0xaeaa…2416 | A | $6,076,217.50 | $3,236.34 |
| 05 | 0x5fae…6e5f | S+ | $5,389,843.37 | $5,389,843.37 |
| 06 | 0xec4a…cf62 | S | $5,333,979.51 | $309,585.65 |
| 07 | 0xeadc…9d55 | S | $5,320,958.06 | $1,113,987.68 |
| 08 | 0xea00…a918 | A+ | $4,785,824.46 | $26,129.58 |
| 09 | 0xbd33…4200 | S | $4,748,825.44 | $0.00 |
| 10 | 0x350e…fcfb | C | $4,723,164.97 | $0.00 |
Show the work
Methodology.
A single public capture. A fixed selection rule. Calculations you can reproduce.
- One capture, one cohort
- We retrieved one public HyperStats API response on 7 October 2026 at 09:17:08 UTC. The query requested limit=100, offset=0, sortBy=pnl_30d, order=desc and showBots=false. We did not combine multiple pages or refresh individual rows after capture.
- Who could enter the sample
- The endpoint returned 18,142 eligible tracked wallet records for this query. Its eligibility includes wallets with open positions or recorded activity in the 30-day window; classified algorithmic wallets are excluded with showBots=false. We selected the first 100 by descending 30-day realized PnL without minimum balance, grade or win-rate filters. Bot classification is not a guarantee that every remaining wallet is operated manually.
- What we measured
- We used the API’s public wallet address, grade, pnl30d.amount and pnl7d.amount. HyperStats describes these amounts as realized exit PnL, covering closed, reduced and liquidated positions. We retain the source decimal strings in the downloads. We do not use the API percentage columns as ROI: their denominator is current portfolio value, not starting equity adjusted for cash flows.
- How we calculated the results
- Top-10 share = sum of the first 10 wallets’ 30D amounts ÷ sum of all 100 wallets’ 30D amounts × 100. The median averages the 50th and 51st amounts in descending order. Grade counts use the returned grade labels. The 7D counts compare each amount with zero. Decimal sums and medians use fixed-point arithmetic; displayed dollar amounts are rounded to cents and the share to one decimal place.
- What the timestamps mean
- The response timestamp was 2026-10-07T09:17:07.845Z. This marks the API response, not a guarantee of simultaneous refreshes for every underlying field. We use the rolling windows returned by the API and do not infer an exact common start time for their source calculations. This edition is frozen; current HyperStats rankings will change.
Read alongside the findings
What this study
can’t tell you.
- Selection bias: this is a deliberately selected group of high 30-day dollar-PnL wallets. All 100 are positive by this selection. It cannot estimate the proportion of profitable Hyperliquid users or describe a typical trader.
- Wallets are not people: one operator may control several addresses. We did not cluster ownership, identify traders, test independence or audit algorithmic-wallet classification.
- Source coverage: we used HyperStats aggregates and did not reconstruct exchange fills or independently audit coverage, fees, funding, cash flows or every field’s freshness. We do not label these amounts as net investment returns.
- Overlapping windows: 7D is compared with 30D at one capture. This cannot establish persistence, a subsequent drawdown, statistical significance or a causal relationship.
- No copy-performance test: entry timing, sizing, leverage, available margin, liquidity and execution can differ for a follower. We did not simulate copying or test any Hypertg strategy.
- Publisher relationship: Hypertg is built by HyperStats, whose data and grades this article uses. This is a first-party descriptive analysis, not an independent rating of HyperStats or the wallets.
From a row to research
Before choosing
a wallet to copy.
Keep the evidence
The data.
The source.
Download the frozen 100-wallet sample or the untouched API response. The calculation script runs locally against the response, without making a network request.
Raw response SHA-256556859bd78048a122d47904ae40bd95cf0ef236553ebafe499c441fefb8c31c8
To reproduce: save the script and raw response in one folder, then run node analysis-2026-10-07.mjs hyperstats-response-2026-10-07.json. Node.js 22 or later.
Before your first trade
About the study.
How to interpret this Hyperliquid wallet study.
Are these the best Hyperliquid wallets to copy?
This study does not identify the best wallets to copy. It describes 100 tracked wallets selected by 30-day realized dollar PnL at one capture. It does not test future returns, drawdown or a follower’s execution.
Link to this answer: Are these the best Hyperliquid wallets to copy?Does zero 7-day realized PnL mean a wallet stopped trading?
No. A zero amount can reflect no realized exits, offsetting gains and losses or the source’s reporting state. It does not establish inactivity, and open-position PnL is outside this comparison.
Link to this answer: Does zero 7-day realized PnL mean a wallet stopped trading?Can I reproduce the findings?
Yes. Download the frozen raw API response and normalized JSON or CSV. The source query, capture time, SHA-256 and calculation script are included. Re-querying the live API will produce a different snapshot as rankings and metrics change.
Link to this answer: Can I reproduce the findings? Hypertg.